-
All Levels
-
24 Weeks
-
MIT Certification
-
Industry Immersion
-
Capstone Projects
Overview
Our Post Graduate in Data Analytics course offers an in-depth exploration of data analysis techniques, including SQL, Excel, Tableau, and Power BI. Focusing on practical applications and real-world case studies, this course equips you with the skills needed to excel in the competitive data analytics industry.
- Data Analyst
- Business Analyst
- SQL developer
- Tableau Developer
- Power BI Developer
- Data Analyst Intern

Targeted Job
Roles

Training and Methodology
By enrolling in this course, you will gain access to -
Practical Training - Practical Training
Industry-Relevant Tools - Training on SQL, Excel, Tableau, and Power BI.
Expert Guidance - Learn from industry experts with continuous support.
Why Choose This
Course?
Enhance Your Analytics Expertise with Practical Training. This Post Graduate in Data Analytics course provides a robust foundation in data analytics, combining theoretical knowledge with practical skills. Prepare for a successful career in data analytics with comprehensive training and real-world applications.
Register Now-
100% Placement Program
Ready yourself for the job market with placement readiness.
-
Real time projects
Work on industry-relevant projects to apply your skills.
-
Reviews and Feedback
Benefit from a continuous feedback and review system that ensures you stay on track and improve throughout your learning journey.
Skills acquired from this course
-
Proficiency in SQL for database management and querying
-
Advanced data manipulation and visualization with Excel, Tableau, and Power BI
-
Expertise in data cleaning, reporting, and analytics
-
Practical experience with real-world data analysis projects
Tools & Languages Included In This course
The Course Syllabus
The course covers important topics.
Logic Building
- Introduction to Programming Languages
- Algorithms and Data Structures
SQL
- SQL Basics and Advanced Concepts
- Data Definition and Manipulation
- Joins, Sub-queries, and Stored Procedures
- Windows function
Advance Excel - Data Visualization and Reporting Using Excel
- Lookup and Reference
- Pivot Tables
- Charts
- What-if Analysis
- Intro to Macros
- Data Visualization/Graph
- Pivot table and Heat Map
- Highlight Table
- Bar Chart
- Line Chart
- Area Chart
- Pie Chart
- Scatter Plot
- Word Cloud
- Tree Map
- Blended Axis
- Dual Axis
- Reference lines
- Reference bends
- Trend lines
- Dashboards and Actions
- Dashboard design
- Dashboards
- Dashboard actions
- Drilldown report
- Pivot Tables
Tableau
- Tableau Architecture and Features
- Data Visualization Techniques
- Dashboard Design and Interactivity
Power BI
- Introduction to Power BI Tools
- Data Preparation and Visualization
- DAX Queries and Report Creation
Course Project
- Industry-Relevant Analytics Project

Want to
experience
excellence?
At Milestone, We are committed to provide a
complete education solution in Thane.
Recruiters looking for Data Science & Analytics Students
Certification For This
Course
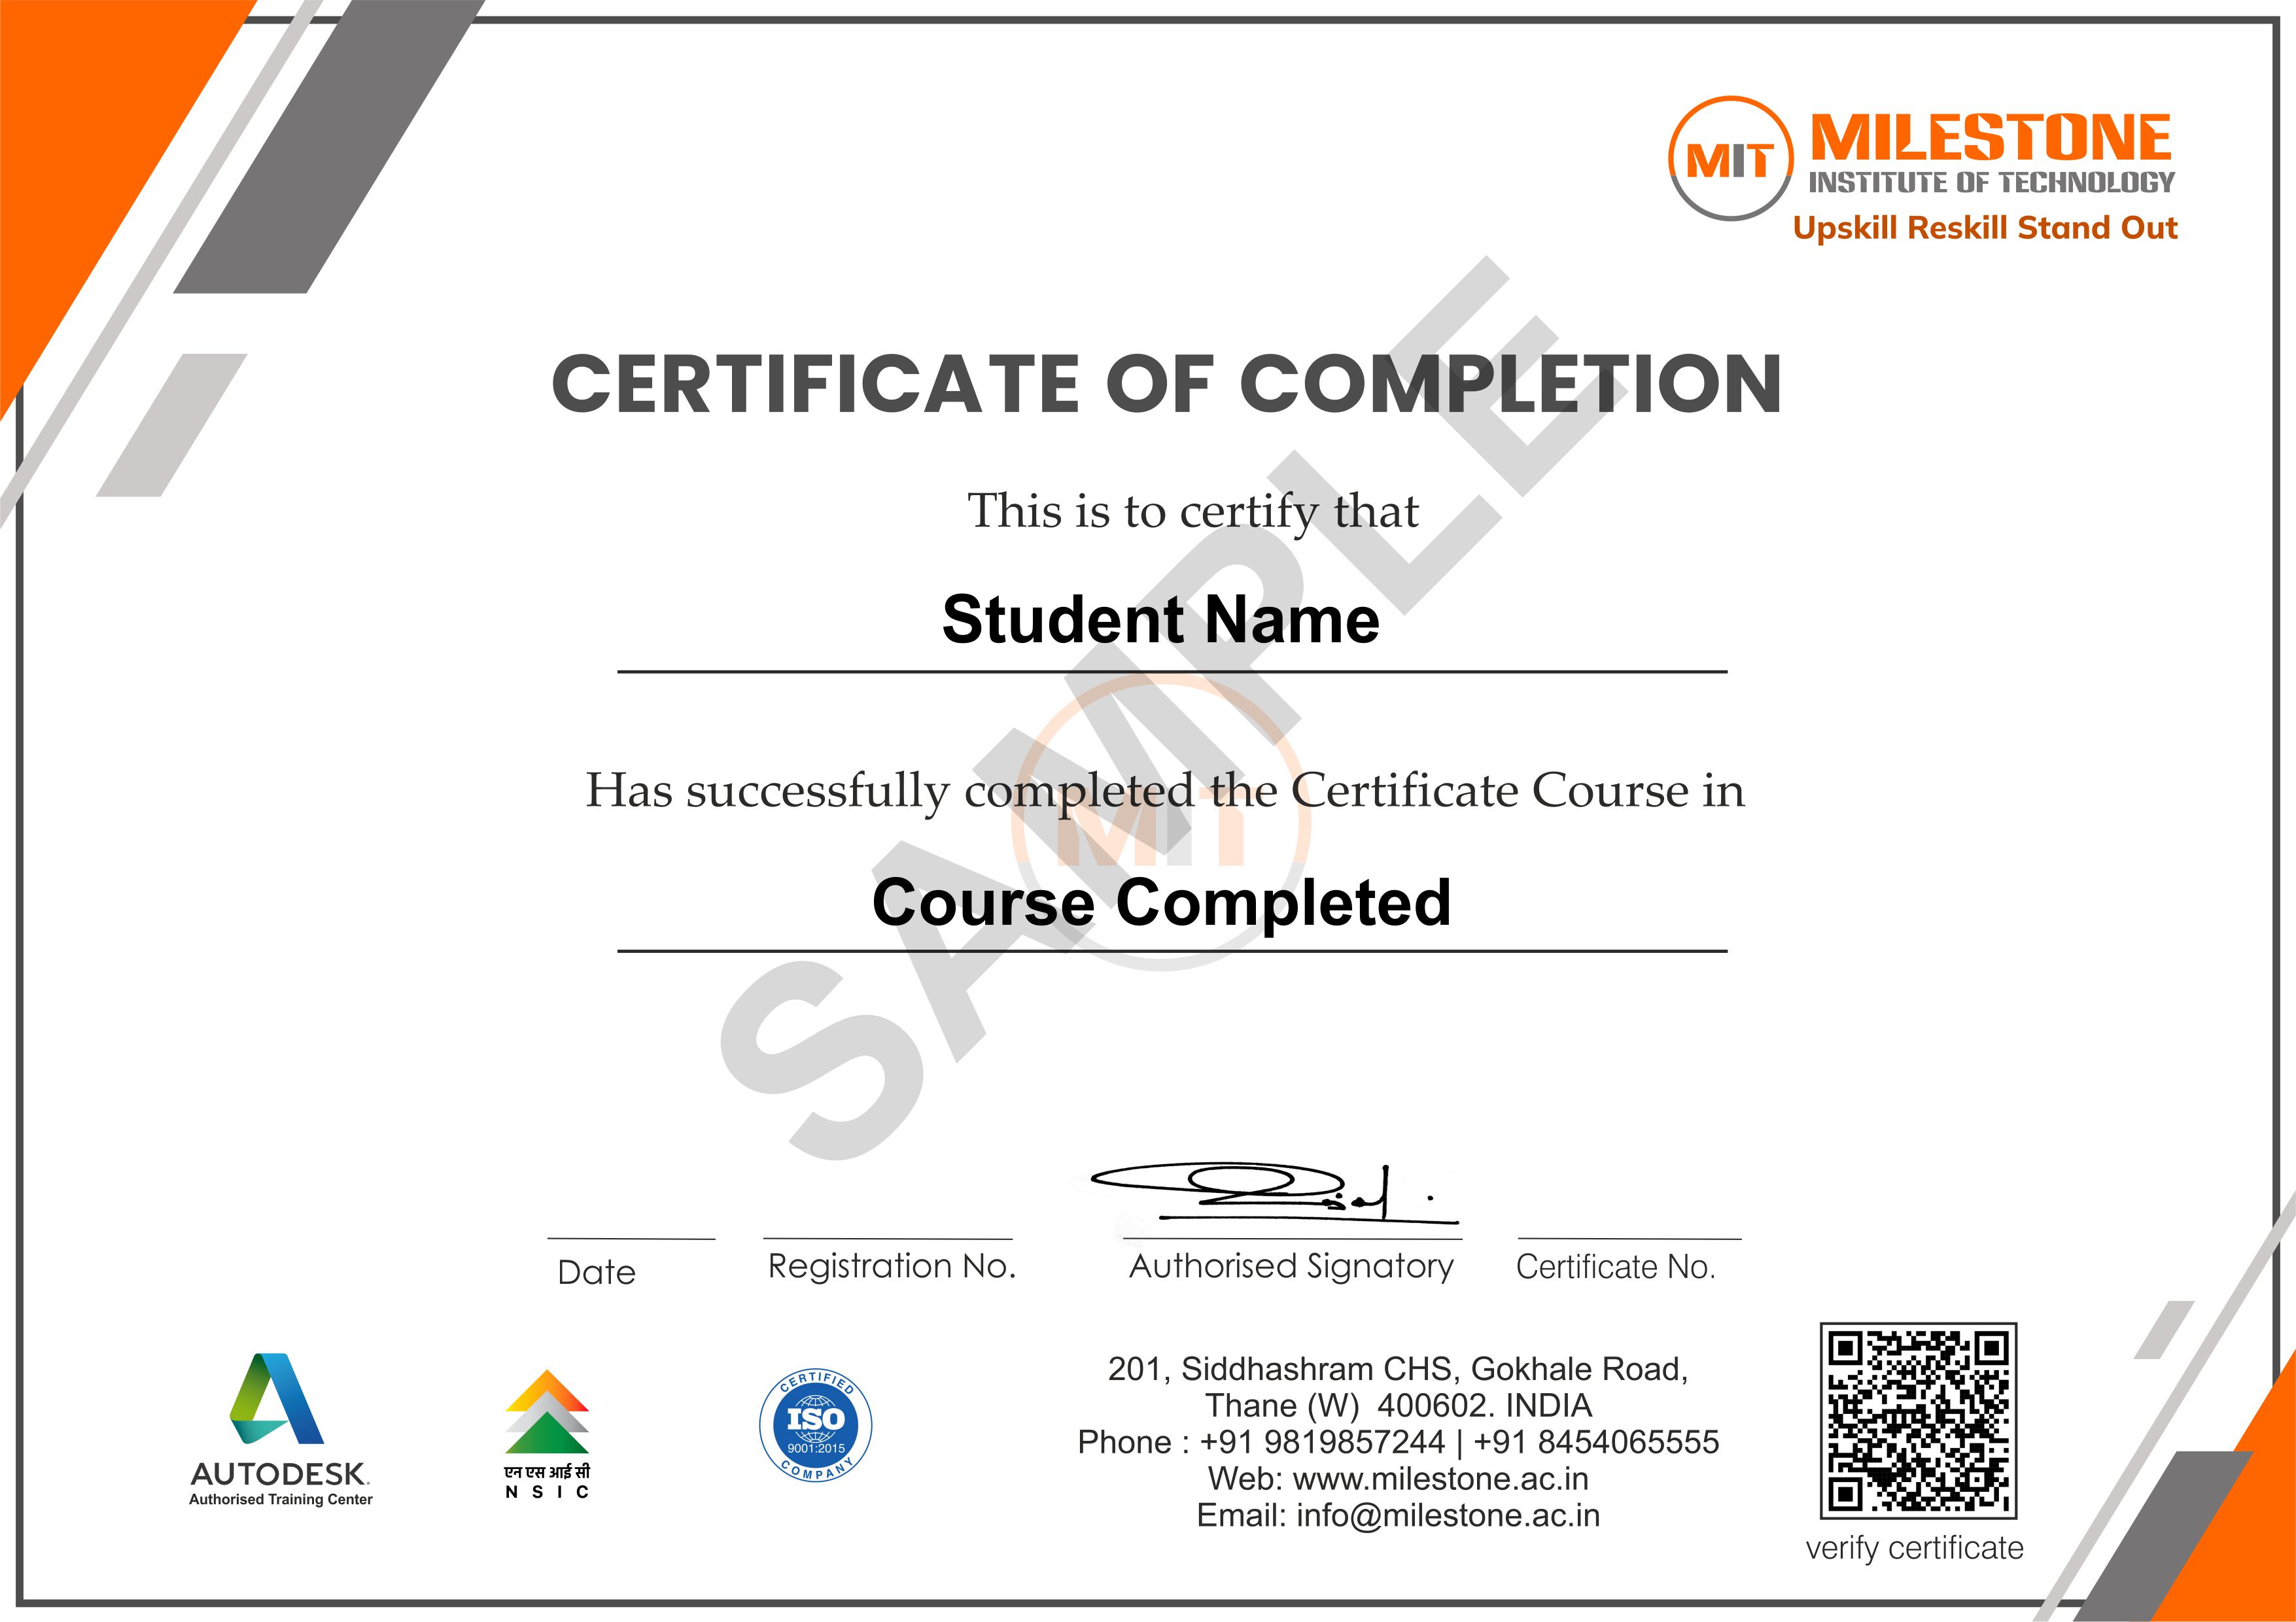
Receive a recognized certification upon course completion, validating your skills and boosting your career prospects.
Register Now

Get in touch today
Frequently Asked Questions
Find answers to all your questions about our diverse course categories. Discover the range of subjects we offer, and learn how to choose the right courses to match your interests and career goals. Let us guide you in navigating our extensive catalog to find the perfect fit for your educational journey.
-
Who can enroll for this course?
Any person with ME, MTech, BE, BTech, BCA, MCA, Msc, Bsc in Computer Science, Bsc IT, Msc IT, Diploma, IT, AI, ML can register for this course.
-
What will be the mode of delivery?
We offer 3 delivery models
1) Classroom
2) Live Online
3) Recorded lectures
Kindly contact us with your requirements. -
Will I receive a certificate after completion of this course?
Yes, you will be getting a certificate from Milestone Institute of Technology.
-
Does this course align with Industry requirements?
Yes, at MIT we ensure our syllabus and exercises are up to date as per industry requirements. We have used industry examples wherever possible in the course material. Additionally, you can also register your interest in Industry internships opportunities with our placement department.
to a whole new level?


