
-

All Levels
-

6 Weeks
-

MIT Certification
-

Industry Immersion
-

Capstone Projects
Overview
This Tableau course equips you with essential skills in data visualization and business intelligence, from connecting raw data sources to creating interactive dashboards. You will learn how to analyze, visualize, and share data insights effectively using Tableau. The course provides hands on experience with real world projects to prepare you for a successful career in analytics and decision making
- Tableau Developer
- Data Analyst
- Business Intelligence Analyst
- Reporting Analyst
- Data Visualization Specialist
- Analytics Consultant

Targeted Job
Roles

Training and Methodology
By enrolling in this course, you will gain access to -
 Hands-On Projects - Build real-world dashboards and visualizations using Tableau.
- Data Connectivity - Connect and transform data from Excel, SQL, and other sources.
- Data Analysis & Calculations - Use Tableau’s formulas and functions to generate insights.
- Visualization & Dashboards - Create interactive dashboards with charts, KPIs, and filters.
Why Choose This
Course?
Master Tableau and take your data visualization skills to the next level. You will learn how to transform complex datasets into clear, interactive dashboards that drive smarter business decisions. The course is designed with practical projects to help you gain industry ready experience. With these skills, you will be prepared for high demand careers in business intelligence, analytics, and data reporting.
Register Now-

100% Placement Assistance Program
Job placement assistance readiness.
-

Real time projects
Receive continuous feedback to enhance your learning.
-

Continuous Feedback
Receive continuous feedback to enhance your learning.

Get Your Tableau Course Brochure
Everything you need to know about the course is in this brochure, plan your learning journey now for successful career journey!
Download brochureSkills acquired from this course
-

Learn Tableau fundamentals, interface, and key features.
-
Connect, clean, and organize data using sorting, filtering, groups, and sets.
-
Create calculated fields and perform data analysis with cross tabs.
-
Build interactive dashboards with actions, drill-downs, and design elements.
-
Master data visualization with charts, graphs, pivot tables, heat maps, and advanced features like dual axis and reference lines.
-
Apply skills through hands-on projects such as the Google Play Dashboard.
Tools & Languages Included In This course
The Course Syllabus
The course covers important topics.
Introduction to Tableau
- What is Tableau
- Architecture of Tableau
- Features of Tableau
- Installation of Tableau Desktop/Public
- Interface of Tableau (Layout, Toolbars, Data pane, Analytics pane etc.)
- How to start with Tableau
- Top Chart in Tableau
- Introduction to the various file type
- Quick Introduction to the user interface in tableau
- How to create data visualization using Tableau feature “show me”
- How to create calculated field
- How to perform operation using cross tab
- Working with workbook data and Worksheet
Organizing data using tableau
- Sort data
- Filter data
- Generating groups
- Building sets
Dashboards and Actions
- Dashboard design
- Dashboards
- Dashboard actions
- Drilldown reports
Data Visualization / Graph
- Pivot table and Heat Map
- Highlight Table
- Bar Chart
- Line Chart
- Area Chart
- Pie Chart
- Trend lines
- Scatter Plot
- Word Cloud
- Tree Map
- Blended Axis
- Dual Axis
- Reference lines
- Reference bends
Tableau Project
- Google Play Dashboard

Want to
experience
excellence?
At Milestone, We are committed to provide a
complete education solution in Thane.
Recruiters looking for Tableau Students for Data Analysis


Certification For This
Course
Earn an industry-recognized Tableau certification upon completing the course, showcasing your skills and boosting your career opportunities.
Register Now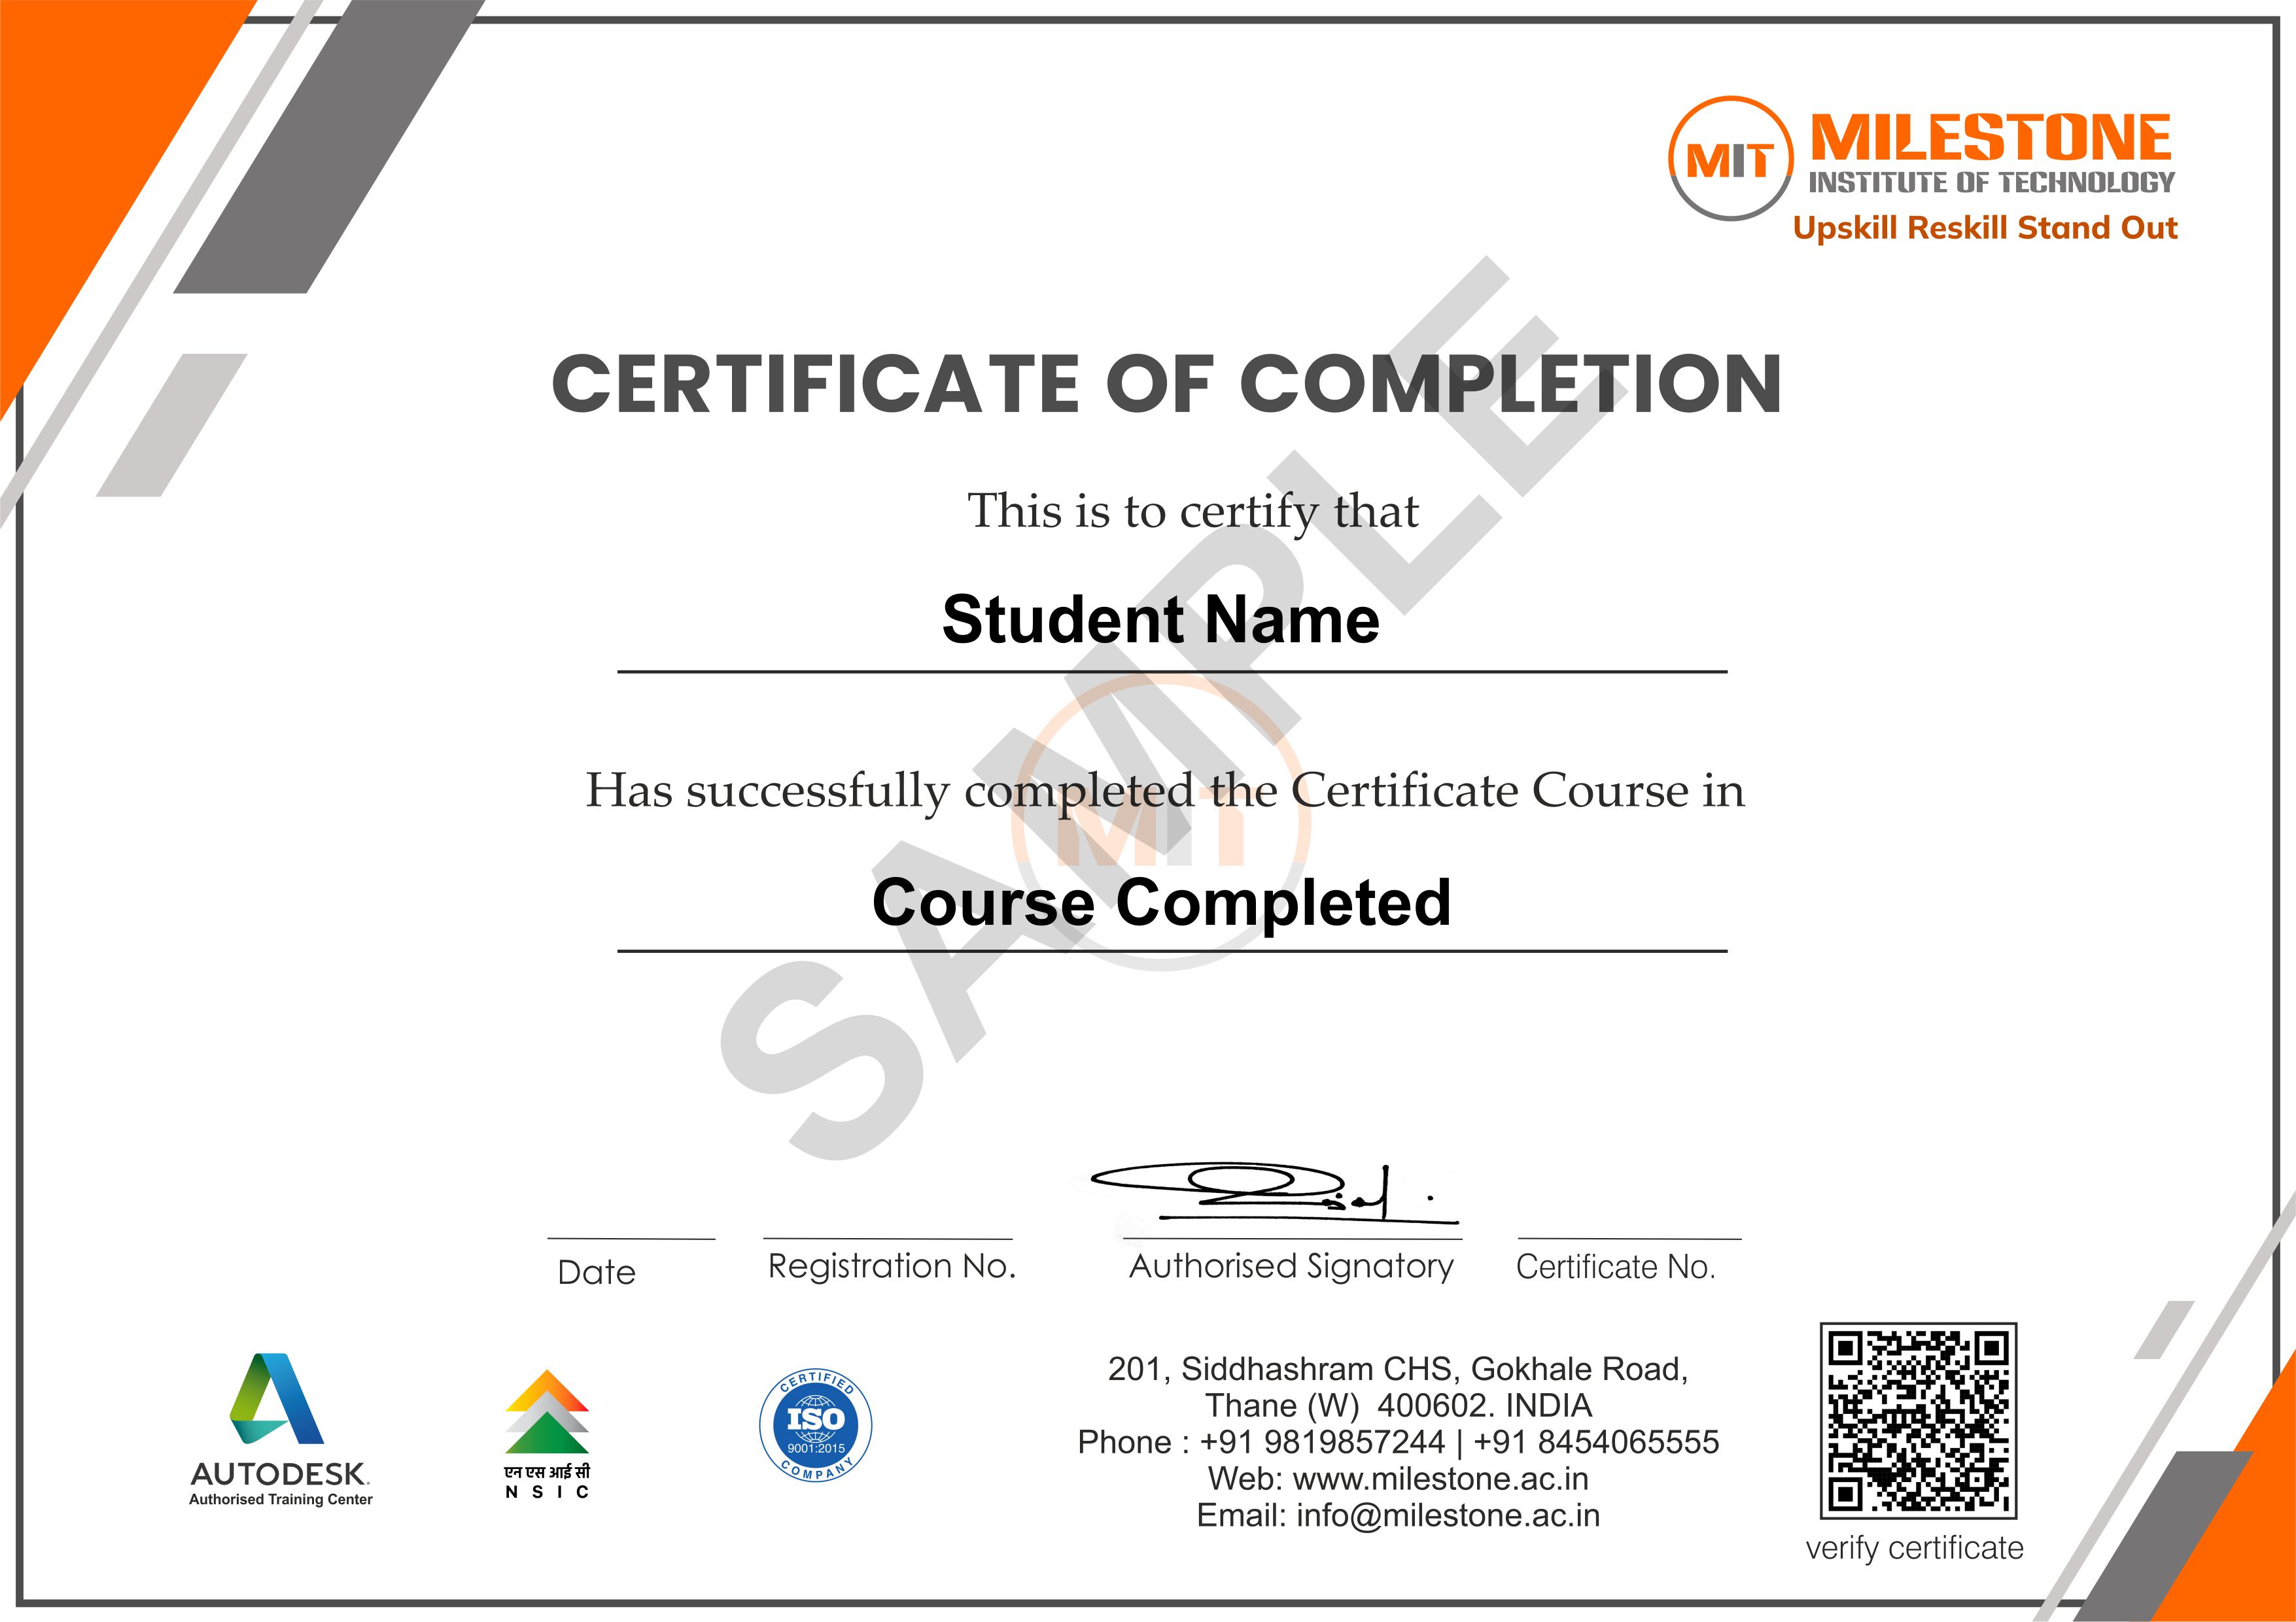

Get in touch today
What Our Students Say
-
There are many demanding software programs, and in my experience, MIT is one of the best choice.
Akshay Kadam
-

Faculty offering personal attention to struggling students is more satisfying compared to other institutes.
Rahul Agawane
-
I'm very thankful to MIT staff for their cooperative support throughout the entire course.
Mohit Talar
Frequently Asked Questions
Get all answers about our Tableau Course to gain in-demand analytics skills and hands-on experience with real-world projects. Learn to create interactive dashboards, analyze data effectively, and advance your career in business intelligence. Get the guidance you need to start your Tableau journey with confidence.
-
Who can enroll for this course?


Any person with 10th , 12th , Graduate from any stream can register for this course.
-
What will be the mode of delivery?
We offer 3 delivery models
1) Classroom
2) Live Online
3) Recorded lectures
Kindly contact us with your requirements. -
Will I receive a certificate after completion of this course?
Yes, you will be getting a certificate from Milestone Institute of Technology.
-
Does this course align with Industry requirements?
Yes, at MIT we ensure our syllabus and exercises are up to date as per industry requirements. We have used industry examples wherever possible in the course material. Additionally, you can also register your interest in Industry internships opportunities with our placement department.
to a whole new level?
